Caesarstone(CSTE: US) - 1Q16 Results
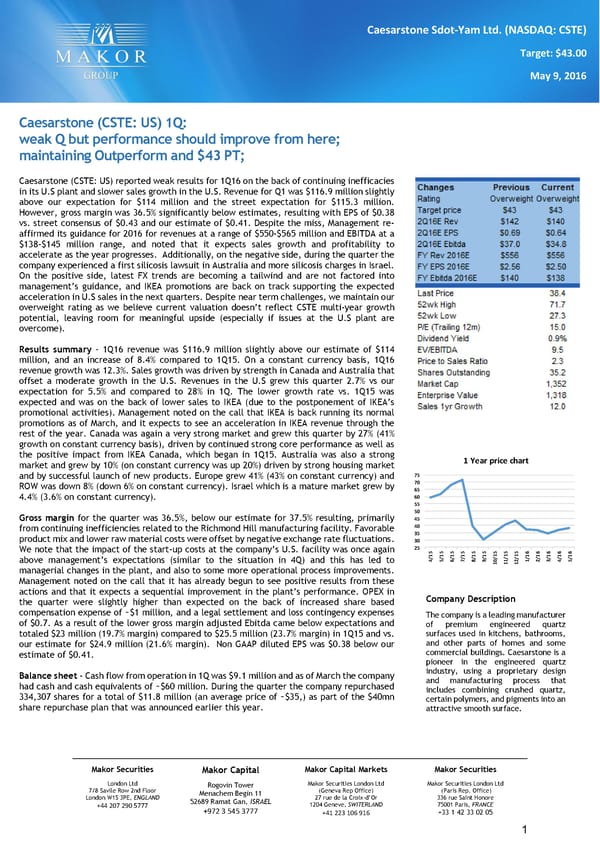
Makor Securities Makor Securities London Ltd (Paris Rep. Office) 336 rue Saint Honore 75001 Paris, FRANCE +33 1 42 33 02 05 Makor Capital Markets Makor Securities London Ltd (Geneva Rep Office) 27 rue de la Croix-d’Or 1204 Geneve, SWITERLAND +41 223 106 916 Makor Capital Rogovin Tower Menachem Begin 11 52689 Ramat Gan, ISRAEL +972 3 545 3777 Makor Securities London Ltd 7/8 Savile Row 2nd Floor London W1S 3PE, ENGLAND +44 207 290 5777 1 Caesarstone Sdot-Yam Ltd. (NASDAQ: CSTE) Target: $43.00 May 9, 2016 Caesarstone (CSTE: US) 1Q: weak Q but performance should improve from here; maintaining Outperform and $43 PT; Caesarstone (CSTE: US) reported weak results for 1Q16 on the back of continuing inefficacies in its U.S plant and slower sales growth in the U.S. Revenue for Q1 was $116.9 million slightly above our expectation for $114 million and the street expectation for $115.3 million. However, gross margin was 36.5% significantly below estimates, resulting with EPS of $0.38 vs. street consensus of $0.43 and our estimate of $0.41. Despite the miss, Management re- affirmed its guidance for 2016 for revenues at a range of $550-$565 million and EBITDA at a $138-$145 million range, and noted that it expects sales growth and profitability to accelerate as the year progresses. Additionally, on the negative side, during the quarter the company experienced a first silicosis lawsuit in Australia and more silicosis charges in Israel. On the positive side, latest FX trends are becoming a tailwind and are not factored into management’s guidance, and IKEA promotions are back on track supporting the expected acceleration in U.S sales in the next quarters. Despite near term challenges, we maintain our overweight rating as we believe current valuation doesn’t reflect CSTE multi-year growth potential, leaving room for meaningful upside (especially if issues at the U.S plant are overcome). Results summary – 1Q16 revenue was $116.9 million slightly above our estimate of $114 million, and an increase of 8.4% compared to 1Q15. On a constant currency basis, 1Q16 revenue growth was 12.3%. Sales growth was driven by strength in Canada and Australia that offset a moderate growth in the U.S. Revenues in the U.S grew this quarter 2.7% vs our expectation for 5.5% and compared to 28% in 1Q. The lower growth rate vs. 1Q15 was expected and was on the back of lower sales to IKEA (due to the postponement of IKEA’s promotional activities). Management noted on the call that IKEA is back running its normal promotions as of March, and it expects to see an acceleration in IKEA revenue through the rest of the year. Canada was again a very strong market and grew this quarter by 27% (41% growth on constant currency basis), driven by continued strong core performance as well as the positive impact from IKEA Canada, which began in 1Q15. Australia was also a strong market and grew by 10% (on constant currency was up 20%) driven by strong housing market and by successful launch of new products. Europe grew 41% (43% on constant currency) and ROW was down 8% (down 6% on constant currency). Israel which is a mature market grew by 4.4% (3.6% on constant currency). Gross margin for the quarter was 36.5%, below our estimate for 37.5% resulting, primarily from continuing inefficiencies related to the Richmond Hill manufacturing facility. Favorable product mix and lower raw material costs were offset by negative exchange rate fluctuations. We note that the impact of the start-up costs at the company’s U.S. facility was once again above management’s expectations (similar to the situation in 4Q) and this has led to managerial changes in the plant, and also to some more operational process improvements. Management noted on the call that it has already begun to see positive results from these actions and that it expects a sequential improvement in the plant’s performance. OPEX in the quarter were slightly higher than expected on the back of increased share based compensation expense of ~$1 million, and a legal settlement and loss contingency expenses of $0.7. As a result of the lower gross margin adjusted Ebitda came below expectations and totaled $23 million (19.7% margin) compared to $25.5 million (23.7% margin) in 1Q15 and vs. our estimate for $24.9 million (21.6% margin). Non GAAP diluted EPS was $0.38 below our estimate of $0.41. Balance sheet - Cash flow from operation in 1Q was $9.1 million and as of March the company had cash and cash equivalents of ~$60 million. During the quarter the company repurchased 334,307 shares for a total of $11.8 million (an average price of ~$35,) as part of the $40mn share repurchase plan that was announced earlier this year. Company Description The company is a leading manufacturer of premium engineered quartz surfaces used in kitchens, bathrooms, and other parts of homes and some commercial buildings. Caesarstone is a pioneer in the engineered quartz industry, using a proprietary design and manufacturing process that includes combining crushed quartz, certain polymers, and pigments into an attractive smooth surface. 2530354045505560657075 4/1 55/1 56/1 57/1 58/1 59/1 510/ 1511/ 1512/ 151/1 62/1 63/1 64/1 65/1 6 1 Year price chart
 Caesarstone(CSTE: US) - 1Q16 Results Page 2